1 Industry, 3 Sales Reps, 3 Different Power BI Reports
After working with dozens of companies on CRM reports, we thought we knew what users wanted. Last year, we built several Power BI reports and thought we’d be smart and sell them as a kit. It didn’t work.
The reality is, people want what they want. Luckily with Microsoft Power BI, everyone can have exactly what they want.
Take some reports we built recently for small sales rep firms. Same industry, same sales software, but they are each want to see completely different data.
Sales Rep 1:
The first sales rep meets with manufacturers four times a year and makes a fancy PowerPoint to show them personal data around specific products, sales volumes and trends. This data has to be pulled from multiple systems manually. And once it goes into the presentation the data is static, frozen in time.
Now, with the Power BI report he can show the client live dashboards, and together they can slice and dice the information. They can choose different dates, include/exclude salespeople, products or territories. The sales rep can even give the manufactures access to the dashboard so they can login to view and analyze their own reports without waiting for those quarterly meetings. The sales rep saves time, the numbers are always up to date, and the manufacturer gets full transparency.
Sales Rep 2:
This sales rep just wanted to analyze the results of his sales team. He wants to know if their sales increased/decreased, do they need more assistance with something, are their sales dropping off in a particular territory? None of the dashboards we did for the first rep would have fit this rep.
Sales Rep 3:
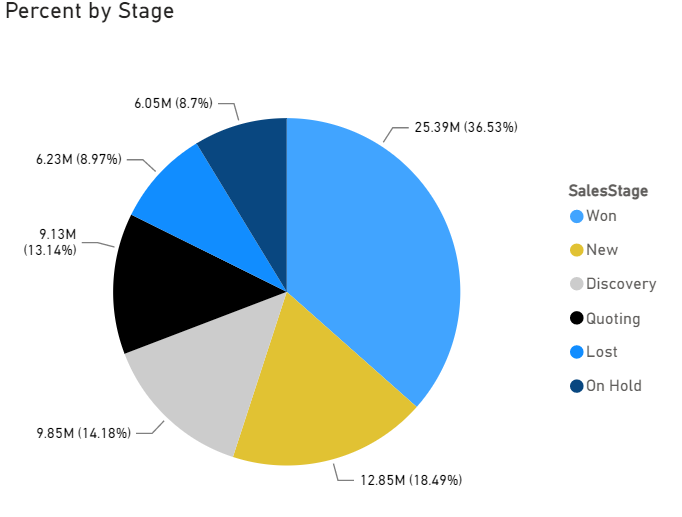
Sales Rep #3 is also the owner of the company. He was spending two full days every quarter to pull data from various systems to analyze the health of his business as a whole. He wants to know who is selling what and the dollars and cents associated with it. Now he has a Power BI dashboard that is always on, so he can slice and dice and view the information any way he wants.
Get the data YOU want with Power BI
Power BI lets you pull information from virtually any application, into one central dashboard. From there you can see it in charts, heat maps, graphs and more.
P2 Automation can help you set up exactly the Power BI reports you want to see. Contact us to start the conversation at (860) 426-8029 or sales@p2automation.com.